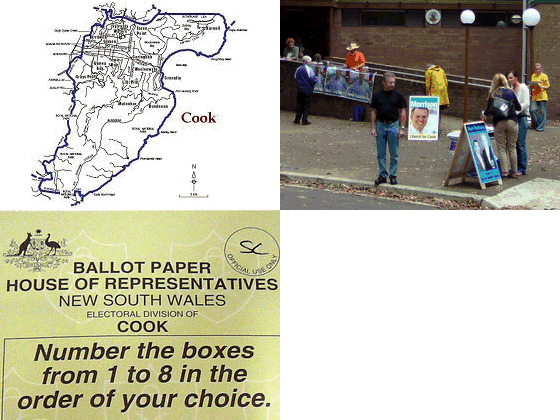
Bundeena Maianbar voters followed the national 6% swing trend to Labor however it was Liberal candidate Scott Morrison who is Cook’s new MP. Below we breakdown the current vote counts.
Bundeena voted counter to the rest of the Cook favouring Labor after two party preferences at 60% versus Cook overall which favoured Liberal at 57%.
Maianbar voted first preferences more along Liberal lines though after two party preferences Labor came out ahead at 55%.
Though the Greens vote was slightly down in both Bundeena & Maianbar voters still showed a significant first preference for the Greens at 15% & 18% versus 6% for Cook overall.
Cook 2007 Results – First Preferences
Polling Places Returned: 39 of 41 Enrolment: 93,396 Turnout: 77.92
Candidate Party Votes % Swing (%) STRANG, Graeme Independent 503 0.72 +0.15 KATSOULAS, Ari Family First 455 0.65 +0.65 POULOS, Patricia Independent 299 0.43 +0.43 WAIZER, Naomi The Greens 4,247 6.06 -0.96 SMITH, Beth Christian Democratic Party (Fred Nile Group) 1,616 2.31 -0.10 BUTTIGIEG, Mark Labor 25,024 35.70 +7.48 MORRISON, Scott Liberal 37,057 52.86 -4.65 PUTRAL, Richard One Nation 900 1.28 -0.65 …… Australian Democrats 0 0.00 -0.95 …… No Goods and Services Tax Party 0 0.00 -1.26 …… Ex-Service, Service & Veterans Party 0 0.00 -0.14 FORMAL 70,101 96.33 +1.79 INFORMAL 2,673 3.67 -1.79 TOTAL 72,774 77.92 -18.40
Cook 2007 Results – Two Candidate Preferred Votes
Polling Places Returned: 38 of 41 Turnout: 77.64%
Candidate Party Votes This Election (%) Last Election (%) Swing (%)BUTTIGIEG, Mark Labor 30,015 42.97 36.72 +6.25 MORRISON, Scott Liberal 39,831 57.03 63.28 -6.25
Bundeena 2007 Results – First Preferences
Candidate Party Votes % Swing (%) STRANG, Graeme Independent 10 0.94 +0.75 KATSOULAS, Ari Family First 3 0.28 +0.28 POULOS, Patricia Independent 1 0.09 +0.09 WAIZER, Naomi The Greens 165 15.55 -1.33 SMITH, Beth Christian Democratic Party (Fred Nile Group) 26 2.45 +0.32 BUTTIGIEG, Mark Labor 466 43.92 +7.83 MORRISON, Scott Liberal 381 35.91 -3.33 PUTRAL, Richard One Nation 9 0.85 -2.77 …… Australian Democrats 0 0.00 -1.11 …… No Goods and Services Tax Party 0 0.00 -0.74 …… Ex-Service, Service & Veterans Party 0 0.00 +0.00 FORMAL 1,061 97.07 +1.16 INFORMAL 32 2.93 -1.16 TOTAL 1,093 1.17 -0.08
Bundeena 2007 Results – Two Candidate Preferred Votes
Candidate Party Votes Percentage (%) Swing (%) BUTTIGIEG, Mark Labor 638 60.13 +6.33 MORRISON, Scott Liberal 423 39.87 -6.33
Maianbar 2007 Results – First Preferences
Candidate Party Votes % Swing (%) STRANG, Graeme Independent 1 0.39 +0.01 KATSOULAS, Ari Family First 2 0.78 +0.78 POULOS, Patricia Independent 0 0.00 +0.00 WAIZER, Naomi The Greens 46 18.04 -2.34 SMITH, Beth Christian Democratic Party (Fred Nile Group) 2 0.78 +0.40 BUTTIGIEG, Mark Labor 98 38.43 +5.74 MORRISON, Scott Liberal 105 41.18 -1.13 PUTRAL, Richard One Nation 1 0.39 -1.92 …… Australian Democrats 0 0.00 +0.00 …… No Goods and Services Tax Party 0 0.00 -1.54 …… Ex-Service, Service & Veterans Party 0 0.00 +0.00 FORMAL 255 98.46 +3.57 INFORMAL 4 1.54 -3.57 TOTAL 259 0.28 -0.02
Maianbar 2007 Results – Two Candidate Preferred Votes
Candidate Party Votes Percentage (%) Swing (%) BUTTIGIEG, Mark Labor 142 55.69 +4.15 MORRISON, Scott Liberal 113 44.31 -4.15

